
KFP Equity Selection Process
Introduction
Traditional equity portfolios are a core part of what we do at KFP. They are often one of the largest components of a client’s portfolio. However, disciplined portfolio construction often gets overlooked in traditional wealth management.
Clients are usually faced with several choices. Do they build a portfolio top-down or bottom-up? Do they take their advisors single stock recommendations, select fund managers or a combination of both? An ad-hoc approach can lead to a highly diversified portfolio, that is often sub-optimally managed and at worst confusing. There can be conflicting styles between the fund managers held, as well as an overlap of positions between these funds. In addition, the portfolios can have arbitrary position sizing, the result of ad-hoc changes without some unified framework. The client may have 2% in a single stock, for example, and yet 1.5% in a fund that holds over a hundred.
Our process
At KFP we offer clients managed portfolios of direct single stocks, constructed is a unified way. We do this with a disciplined and proprietary process for selecting single stocks from a global pool of approximately 10,000. The process described below was developed with the primary goal of identifying and investing in the world’s most profitable and high-quality companies. The secondary objective is to favour stocks with above average ESG factors in order to reduce risk.
This can help clients construct a disciplined equity strategy built on sound fundamentals and good governance. Furthermore, the process gives investors a globally diversified portfolio without paying additional ETF or actively managed fund fees.
Rationale
To capture global equity returns, we are ultimately capturing global earnings. And those with the highest earnings are generally rewarded with higher market capitalisation. Hence indices generally reflect well the distribution of stocks claim on global consumption. But there is a flaw. For one, market capitalisation weighted portfolios are at the mercy of investor expectations of the stock, distorting relationship between capitalisation and profitability. For example, we saw until Oct 2021, many tech stocks trading at extremely high capitalisations relative to their earnings (in many cases no earnings). Secondly, earnings are not necessarily a good measure of profitability. They are distorted and reflect results after many adjustments and decisions made by management such as capex and other expenditure. Revenues are a cleaner measure but make comparison between high and low margin businesses difficult. We therefore prefer to use cashflows as the favoured measure of profitability; revenues can be considered vanity, while cashflow is reality.
Therefore, our primary adjustment is selecting stocks that are the most profitable in the world, measured by Free Cash Flow (FCF), not net profit or revenue. FCF measures how much income is available to a company, and provides the greatest resource to reinvest in research & development and CAPEX. This in turn enables companies to grow their earnings sustainably.
We replace the subjective market constraint of valuation, with the more objective one of profit. Unlike using valuation measures for selection (including market capitalisation), we are not attempting to outsmart the market; assuming that our stocks are ‘under-priced’ with the expectation that the market will agree and eventually bid them higher. The stocks are, rather simply and cleanly, the companies that collectively account for most of the GDP that flows to corporate profits.
The second major step is identifying which stocks have the highest quality balance sheets and earnings in terms of margin, cash flow, stability, asset turnover and other performance measures. We study and use a combination of metrics, and some are used to identify potential risks such as poor turnover, liquidity and high debt. This helps to avoid stocks with the potential to run into financial trouble, and search only for ‘high-quality’ names. We also consider those stocks that have analysts providing positive earnings revisions, as investors respond to these changes. Finally, we select those that have high ESG scores, primarily to eliminate companies that fail materially on governance and other non-financial factors.
Portfolio construction & benchmark
A global mandate using this process will be constructed to deliver similar exposures and risks as our preferred benchmark, the MSCI ACWI. The MSCI ACWI Index, MSCI’s flagship global equity index, is designed to represent performance of the full opportunity set of large and mid-cap stocks across 23 developed and 24 emerging markets. As of June 2021, it covers approximately 85% of the free float-adjusted market capitalization in each market.
Out of our 10,000 stock universe, our results are 60-90 stocks that pass positively. We take the companies that have the best measures and highest cashflows within their respective regions and construct a basket that is in proportion to the MSCI ACWI weights. This eliminates some of the tracking due to regional currency, political, monetary policy effects we otherwise see. Our final portfolio is comprised of 29-32 stocks of the world’s most profitable and high-quality companies.
Position Management
While the shortlist of stocks evolves relatively slowly, since the main inputs are fundamental data, we manage the positions actively. This is done on discretionary decisions to exit or re-buy positions. The decisions are made on relative valuation and price action. We look for opportunities to exit stocks that appear stretched, according to our models, and wait for better entry points – as long as they continue to meet the financial criteria at that re-entry date.
A recent example is LVMH. We sold the position on 07.10.2021 at EUR 636.13 and re-bought on the 07.03.2022 at EUR 565.55. We did not believe the company’s fundamentals and profitability changed significantly; it remained one of the highest FCF generating companies in the world with an excellent balance sheet. But our price and valuation signals motivated us to exit the stock before re-entering five months later.
Actual Portfolio Performance
We have been managing such portfolios since October 2020, and so now there is sufficient data to compare the results against the MSCI ACWI. At the time of writing, there are 28 stocks. The below chart shows our actual performance over the last 12 months on daily data.
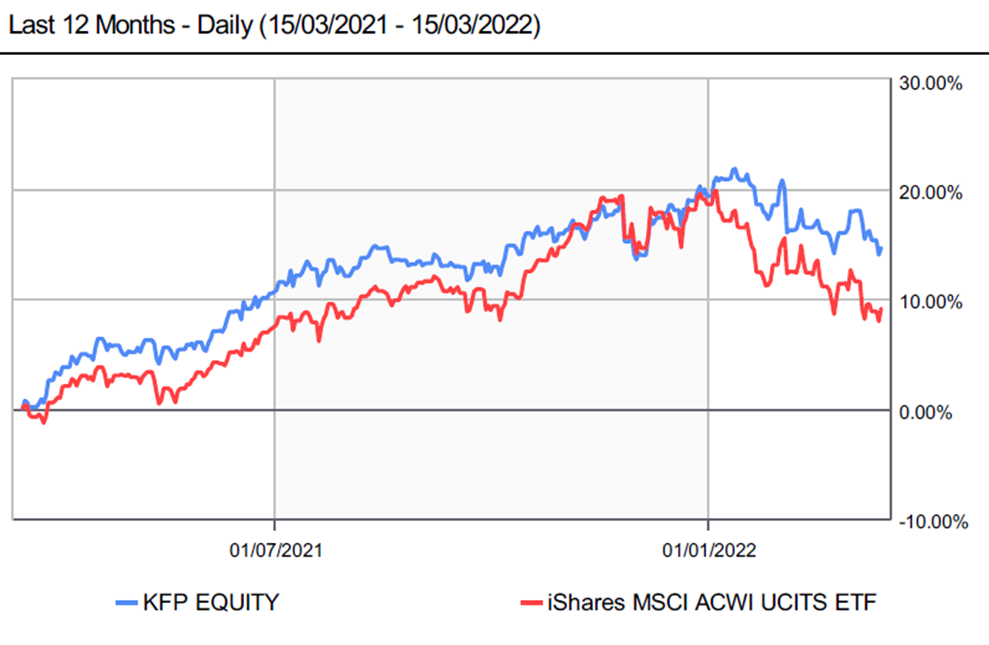
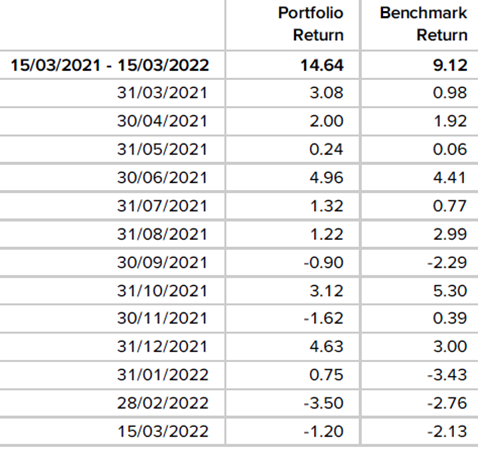
On a YTD basis the portfolio is -3.94% (vs MSCI ACWI -8.09%). The tracking to the MSCI ACWI is sufficiently close, while the portfolio has significantly less volatility – an 8.8% Standard Deviation (vs MSCI ACWI 10.73%).
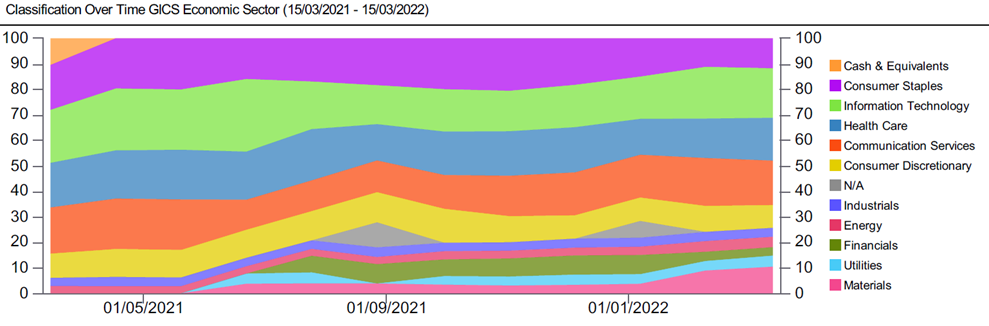
The position management can result in quite an active asset allocation, as can be seen in the sector sand-chart. Highly valued IT stocks were reduced through the end of 2021, and some bought back during this 2022 correction. Materials, which did not feature at the start of 2021, now make up 10% of the portfolio.
The portfolio has lower valuations too; 1 Year Forward PE of 12.7 vs MSCI ACWI 15.6. Perhaps not surprisingly – we focus on raw profit, rather than market valuations, and so we exclude companies with large market caps unsupported by comparable cash flows or earnings. Such companies are valued on future growth, therefore the portfolio has slightly lower EPS Growth of 4.5% vs 8.3% for the MSCI ACWI. Similarly to its lower valuations, the resulting portfolio has higher average net profit margins of 15% vs 10.9% for the MSCI ACWI.
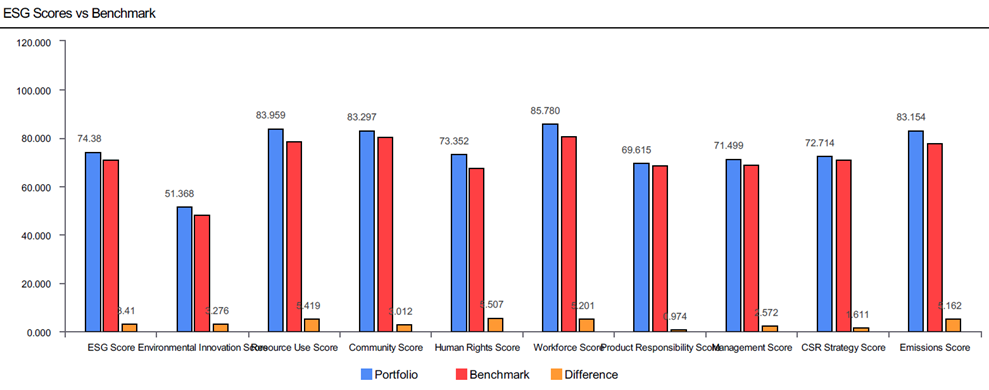
From an ESG perspective, the portfolio has higher average scores across a range of metrics than the benchmark. We believe that by avoiding companies with low scores – particularly Governance scores – we can mitigate against some of the non-financial risks that add pressure to investor selling.
In summary, the KFP Equity Selection Process is an integrated framework that provides our clients with an actively managed portfolio of single line stocks. The portfolio can be used to replace, or compliment, their existing equity investments.
Our clients can not only benefit from the transparency and active management, but also avoid the additional costs related to third party products or funds. The system allows us, as managers, greater control and discretion to invest in stocks according to the factors we believe matter most in capturing global equity returns.
The content of this article does not constitute investment or financial advice and may not be relied upon as such. It does not constitute an offer or invitation for the sale or purchase of services or securities and shall not form the basis of any contract. Key Family Partners SA does not accept any liability for any direct, indirect or consequential loss arising from any use of this publication.